
- All
- Product Name
- Product Keyword
- Product Model
- Product Summary
- Product Description
- Multi Field Search
Views: 0 Author: Site Editor Publish Time: 2026-10-08 Origin: Site


Charging station operators invest heavily in top-tier infrastructure. They expect fast, reliable performance. Yet, they often face customer complaints when vehicles fail to hit the charger's advertised peak speeds. This discrepancy creates significant operational friction. However, it is rarely a hardware failure. Instead, actual power delivery relies on a complex, negotiated handshake. The charger, the onboard computer, and environmental realities must all align dynamically. Minor shifts in these variables drastically alter performance. This article serves as a technical and strategic guide. Fleet managers and station operators will learn how to navigate these variables effectively. You will discover the physics behind battery limitations. We will uncover why thermal constraints throttle speed. Finally, you will understand how to manage user expectations properly and make informed procurement decisions that maximize site efficiency.
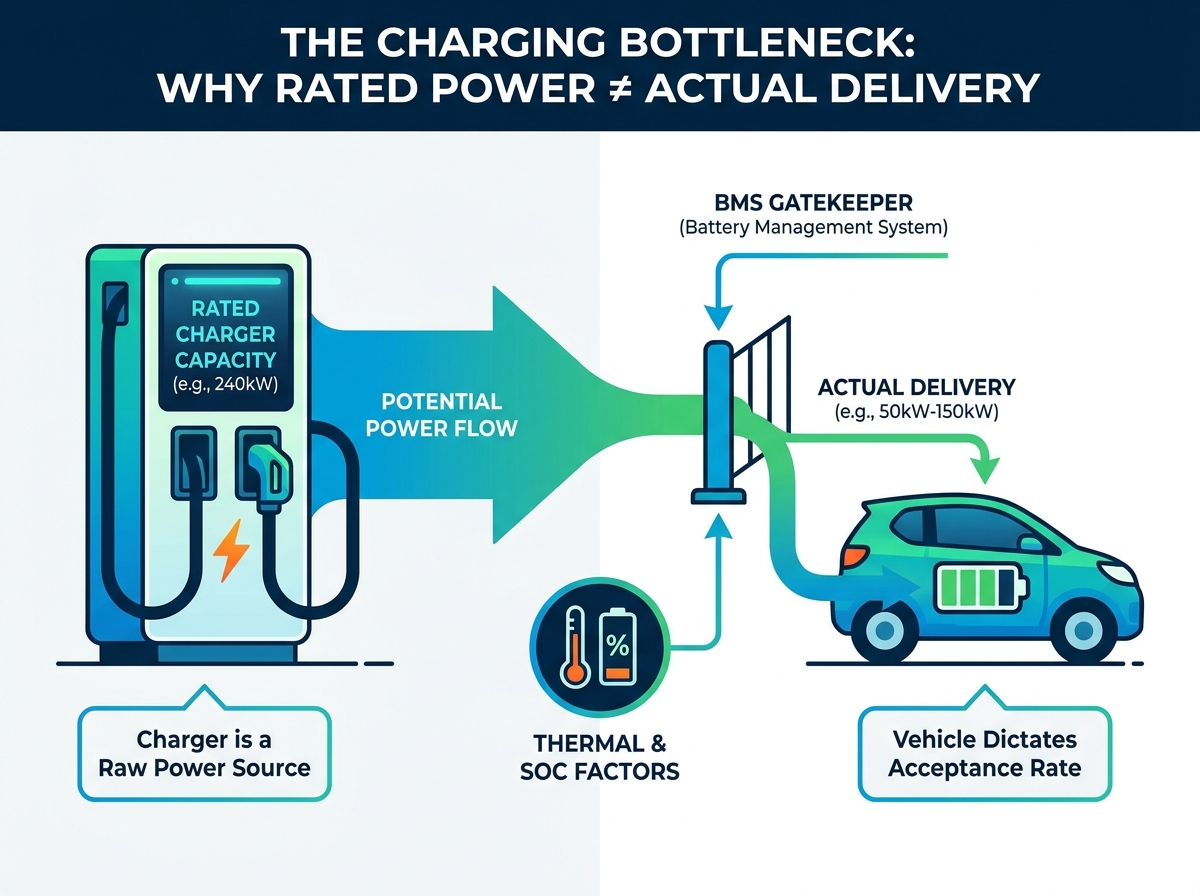
The vehicle’s Battery Management System (BMS)—not the charger—dictates the maximum allowable power draw at any given second.
An EV charging curve naturally tapers off as the battery approaches 80% capacity to protect battery health and longevity.
Environmental extremes (both hot and cold) force thermal throttling, significantly reducing actual power output.
Deploying a high-power DC charger requires operators to account for site-level grid constraints and dynamic load balancing (e.g., dual-port power splitting).
Misaligned expectations cause the primary business problem at public charging stations. Drivers see the nameplate rating on a charging pedestal and assume they will receive that exact speed. When they do not, they assume the equipment is broken. You must understand that the charger is simply a raw power source. It does not force electricity into the vehicle. Instead, the vehicle controls the transaction.
The Battery Management System (BMS) acts as the ultimate gatekeeper. Every electric vehicle contains an onboard computer dedicated to monitoring battery health. When a user plugs in a vehicle, the BMS initiates a digital handshake with the charger. The vehicle dictates the maximum voltage and current it can safely accept. The charger merely responds to these commands.
Hardware reality dictates this relationship entirely. Consider a scenario where a user plugs a 50kW-capable electric vehicle into a 240kW DC EV charger. The vehicle will only ever draw 50kW. The station actively scales down its output to meet the vehicle's safe limits. Pushing more power would severely damage the battery chemistry.
Operators must evaluate their local vehicle demographics carefully. Investing in ultra-high-speed infrastructure may not yield immediate returns. If the local fleet or regional market primarily consists of lower-voltage vehicles, upgrading equipment offers little benefit. The infrastructure will remain heavily underutilized.
The Handshake Protocol: Vehicles communicate limits via standard protocols like ISO 15118.
Current Limits: Older vehicles often cap amperage at 200A or lower.
Voltage Architecture: A 400V vehicle cannot maximize a charger designed for 800V peak efficiency.
Hardware Constraints: Connectors, cables, and internal contactors all define physical bottlenecks.
Electric vehicle charging is inherently non-linear. The physics governing the State of Charge (SoC) dictate this behavior. You can compare the process to pouring water into a glass. When the glass is empty, you can pour quickly without worrying about spilling. As the water level approaches the rim, you must slow down to avoid overflowing. Battery chemistry follows an identical principle.
The 10% to 80% range represents the sweet spot for fast charging. Maximum rated power is typically only achievable when the battery is at a very low SoC. During this phase, lithium ions flow freely and embed themselves into the anode quickly. As the battery fills, internal resistance increases. The BMS steps down the requested power sequentially.
A significant drop-off occurs after 80% capacity. Power delivery drops substantially to prevent lithium plating. This physical phenomenon happens when lithium ions accumulate on the surface of the anode instead of intercalating into it. It causes permanent battery degradation and increases the risk of short circuits. Therefore, the BMS drastically throttles input power.
Educating end-users on charging curves is critical. When drivers understand this drop-off, they stop trying to charge to 100% at public stations. This behavior modification optimizes EV charging time for everyone. It significantly improves station turnover rates, directly boosting revenue potential.
Table: Typical Charging Curve Stages
State of Charge (SoC) | Power Delivery Behavior | BMS Action |
|---|---|---|
0% - 10% | Ramping Up | Verifies battery safety and initiates thermal conditioning. |
10% - 60% | Peak Charging Phase | Requests maximum allowable voltage and amperage. |
60% - 80% | Gradual Tapering | Slows intake as internal resistance builds. |
80% - 100% | Drastic Throttling | Switches to trickle speeds to prevent lithium plating. |
Temperature fundamentally governs lithium-ion battery performance. Both environmental extremes and self-generated heat force thermal throttling. This dramatically reduces the actual power output a user experiences at the plug. Let us examine the two primary temperature extremes.
Coldgating occurs in low-temperature environments. Cold lithium-ion batteries exhibit high internal resistance. The electrolyte becomes viscous, slowing ion movement. If the charger pushes maximum current into a cold pack, the battery will degrade. The BMS intentionally throttles the charging speed. It routes energy to onboard heaters to warm the pack. Once the battery reaches its optimal operating window, the BMS increases the power request.
Conversely, sustained high-power charging generates immense heat. Overheating poses a massive safety risk. If the battery or the charger's cooling system reaches a thermal threshold, power is dialed back immediately. This prevents thermal runaway, a dangerous condition where cells combust.
Infrastructure considerations are paramount for operators. You must evaluate the thermal management capabilities of the charger itself. Siting stations in full sun without canopies accelerates hardware overheating. Furthermore, you must choose appropriate cooling technologies based on deployment climate.
Air-Cooled Systems: Cost-effective but prone to derating in hot climates under heavy use.
Liquid-Cooled Cables: Utilize dielectric fluid to shed heat actively. Essential for sustained outputs above 250A.
Phase-Change Cooling: Advanced designs that absorb intense thermal spikes during peak sessions.
Hardware ratings tell only half the story. The broader site architecture heavily influences individual session speeds. Shared power constraints frequently catch drivers off guard. Dual-gun chargers look like two independent systems, but they share a single backend power cabinet.
If a site deploys a dual-port unit with a 240kW capacity, plugging in one vehicle might yield the full output. However, plugging in two vehicles simultaneously triggers the station's software. It will typically split the power evenly, offering 120kW per vehicle. Some systems allocate power purely on a first-come, first-served basis. If the first vehicle demands 150kW, the second vehicle receives only 90kW.
Grid limitations present another massive bottleneck. Utility grids rarely have unlimited capacity. A site transformer might be rated for 500kW total. If you install four 200kW chargers, the theoretical peak demand is 800kW. The site simply cannot supply maximum power if all units are occupied.
When this happens, site-wide load management protocols activate. The central controller throttles every active dispenser to keep total demand below the transformer limit. This prevents tripped breakers and massive utility demand charges. Therefore, advise buyers to conduct a rigorous scalability check. You must audit your site's electrical capacity before upgrading hardware. Otherwise, you end up paying for stranded, unusable capacity.
Table: Power Allocation Strategies
Management Type | Operational Behavior | Driver Impact |
|---|---|---|
Static Load Balancing | Divides power equally regardless of vehicle demand. | Slower overall speeds. Vehicles near 80% still hoard full allocation. |
Dynamic Load Balancing | Shifts power constantly based on real-time BMS requests. | Optimizes speed. Routes unused capacity from full cars to empty ones. |
Selecting the right hardware mitigates many performance complaints. You should adopt a features-to-outcomes framework during procurement. Look past the marketing brochures and evaluate the internal power architecture. The best models feature advanced modular power allocation. Instead of relying on a hard 50/50 split, they dynamically route power in 30kW increments. This ensures no electricity is wasted.
Reliability and uptime matter more than theoretical peaks. If a unit is underperforming due to a hardware fault rather than a BMS limit, you need immediate visibility. Robust remote diagnostics are essential. Operators need a dashboard that differentiates between vehicle-side throttling and station-side sensor failures. This prevents unnecessary maintenance visits.
Future-proofing requires strategic capital allocation. Investing in 400A+ liquid-cooled systems makes sense for long-term scalability. Today's average vehicle cannot fully utilize that current. However, automotive battery architectures are migrating rapidly from 400V to 800V. Installing robust thermal hardware now prevents costly retrofits later.
Your shortlisting logic should prioritize intelligence over brute force. Evaluate vendors based on their backend software sophistication. Assess their thermal management hardware closely. Demand transparent compliance with ISO 15118 standards. Plug & Charge capabilities streamline the digital handshake, reducing session initiation errors and improving overall satisfaction.
A fast charger frequently misses its peak rated power. However, this is a feature of safe operation, not a flaw. Actual speeds are governed by physics, battery health algorithms, and site load management. The charger and vehicle constantly negotiate to protect hardware and ensure safety. Operators who understand this dynamic can avoid unnecessary equipment replacements and calm frustrated users.
Moving forward, decision-makers must audit their current grid capacity and user demographics rigorously. Do this before selecting your next high-power DC charger. Prioritize dynamic power management and robust software over raw, theoretical peak numbers. By managing thermal limits and educating drivers on charging curves, you will optimize site turnover and ensure long-term profitability.
A: No. Chargers are designed to modulate output based on the vehicle's request. Running below peak capacity often results in less thermal stress on the charger's internal components. This actually extends the lifespan of the power modules and cooling systems.
A: This is the standard EV charging curve in action. As the battery fills (typically crossing the 70-80% threshold), the vehicle's BMS slows the power intake to protect battery chemistry. It prevents issues like lithium plating, ensuring the battery remains healthy over years of use.
A: Yes. Deploying higher-capacity chargers requires significantly more site power (three-phase AC input at higher amperages). It often necessitates transformer upgrades or the integration of battery energy storage systems (BESS) to handle the intense peak loads without destabilizing the local grid.
A: Yes. Both vehicle and charger manufacturers frequently release updates that optimize the handshake protocol and thermal management curves. These software refinements can unlock better sustained charging speeds and fix compatibility issues without changing physical hardware.


