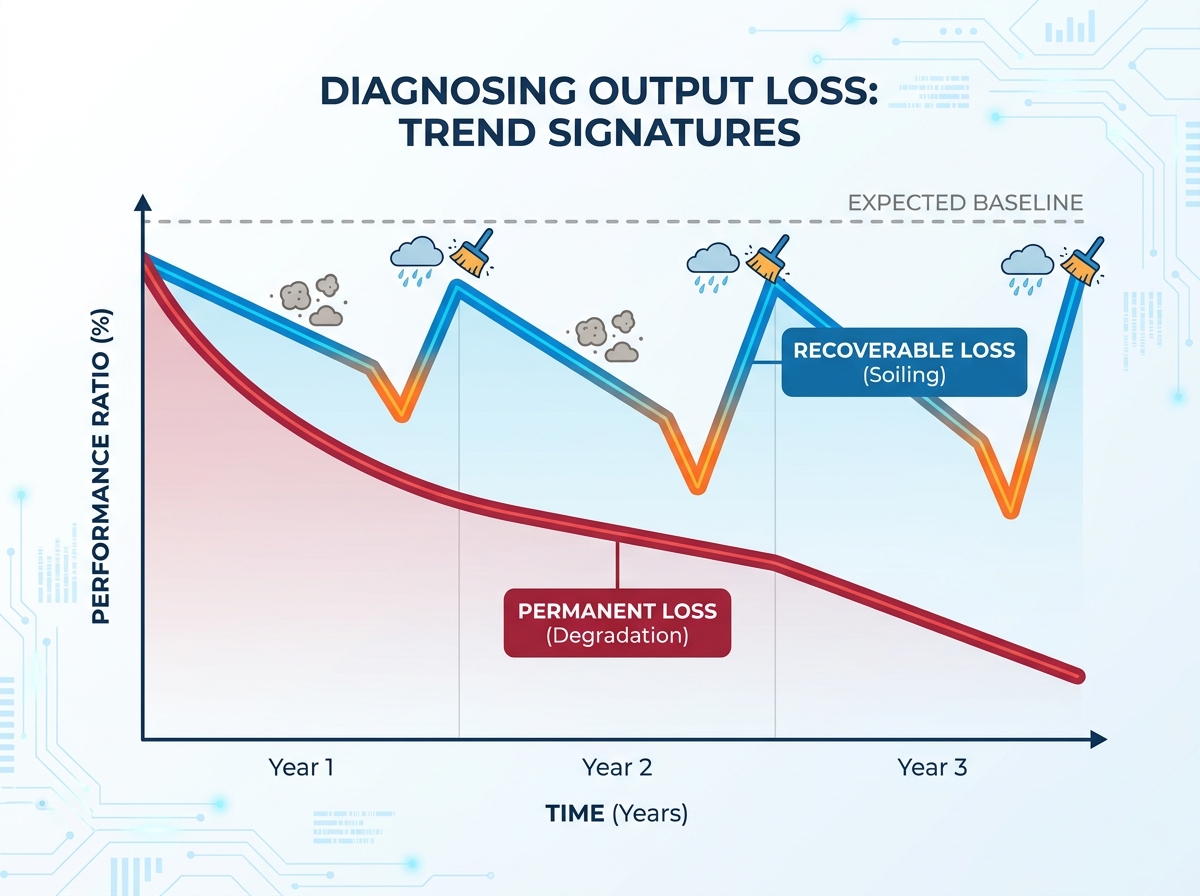
When a solar asset's Performance Ratio (PR) unexpectedly drops below the baseline, O&M teams face a critical operational challenge. They must immediately determine whether the yield loss is a temporary anomaly or a permanent hardware failure. Misdiagnosing this drop carries a steep financial price. Dispatching cleaning crews unnecessarily burns through operating budgets without delivering a return. Conversely, ignoring undetected permanent faults leads to missed warranty claims and severely compounded revenue losses over the project lifespan.
This article provides a comprehensive, data-driven diagnostic framework. It helps operators isolate recoverable soiling losses from irreversible physical wear. By establishing accurate performance baselines and analyzing trend signatures, you will learn how to pinpoint actionable thresholds. We will guide you through leveraging granular data to trigger targeted, ROI-positive O&M interventions and protect long-term asset profitability.
Key Takeaways
Symptom variance: Soiling losses typically present as seasonal, reversible step-changes or rapid localized drops, whereas physical degradation follows a steady, compounding year-over-year decline.
Data isolation is critical: Accurately diagnosing underperformance requires normalizing weather data and accounting for system-specific variables like bifacial module power gain.
Actionable thresholds: Determining the exact tipping point for dispatching cleaning crews relies on calculating when the cost of accumulated soiling exceeds the cost of a cleaning cycle.
Warranty validation: Irreversible performance drops require rigorous IV curve tracing and historical PR documentation to build a defensible warranty claim with the manufacturer.
The Business Impact of Misdiagnosing PV Module Underperformance
Treating all solar output drops as identical issues creates significant financial exposure. System underperformance is inevitable. However, operators often fail to correctly identify the root cause. This failure directly impacts the bottom line. Accurate diagnosis is not just a technical necessity. It is a fundamental financial safeguard for solar investments.
The OPEX Trap (False Positives for Soiling)
Many operators fall into a reactive cycle. They see a dip in energy production and immediately schedule a cleaning. We call this the OPEX trap. Scheduling aggressive cleaning cycles without verifying the root cause quickly depletes operations and maintenance budgets. If the underlying issue is electrical degradation, washing the panels achieves nothing. You spend capital on labor, water, and equipment mobilization, yet you fail to restore the expected yield. This misallocation drains resources rapidly.
The CAPEX Risk (False Negatives for Degradation)
Ignoring long-term, linear output declines introduces massive capital risks. Operators often attribute slow yield decay to stubborn dust or seasonal variations. This assumption is dangerous. It risks allowing underperforming assets to age past their warranty claim windows. If you miss a manufacturer warranty deadline, you absorb the full cost of replacing defective hardware. You also suffer compounding revenue losses for the remainder of the plant's operational life.
Success Criteria
A successful diagnostic approach requires high data hygiene. You must achieve a definitive separation of temporary environmental factors from hardware failures. You can accomplish this using existing Supervisory Control and Data Acquisition (SCADA) systems, PR calculations, and localized weather data. We recommend establishing firm workflows to ensure data-driven decision-making.
Data accuracy: Ensure weather sensors undergo regular calibration.
Granular monitoring: Use string-level monitoring to spot localized faults.
Automated alerts: Configure software to flag deviations from expected weather-adjusted PR.
Defining the Loss Mechanisms: Soiling vs. System Degradation
To accurately diagnose underperformance, operators must understand the fundamental differences between temporary blockages and permanent material failures.
Recoverable Loss: Soiling Dynamics
Soiling refers to the accumulation of environmental debris on the solar panel surface. Airborne particulate matter temporarily blocks solar irradiance from reaching the photovoltaic cells. Common culprits include dust, industrial ash, agricultural pollen, bird droppings, and snow. The defining characteristic of soiling is reversibility. Yield is entirely recoverable post-cleaning or immediately following a significant rainfall event.
Micro-environmental factors heavily dictate accumulation rates. Low tilt angles trap dust more easily than steep angles. Proximity to agricultural fields increases pollen and organic debris buildup during harvest seasons. Installations near industrial zones often suffer from sticky soot accumulation. This soot does not wash away easily during light rain. You must analyze these local variables to predict expected soiling rates.
Permanent Loss: PV Module Degradation
Degradation involves the irreversible electrochemical or mechanical deterioration of the solar hardware. Unlike dust, you cannot wash this away. The physical structure of the cell or the protective materials fundamentally breaks down over time.
Common categorizations of degradation include:
Light-Induced Degradation (LID): Occurs during the first few days of sunlight exposure as oxygen and boron react within the silicon wafer.
Potential-Induced Degradation (PID): A voltage leak from the cells to the module frame, driving sodium ions into the cell and destroying efficiency.
EVA Yellowing: Ultraviolet light degrades the encapsulant material, turning it yellow or brown. This limits light transmission to the cells.
Micro-cracking: Invisible fractures form in the silicon due to thermal stress, heavy snow loads, or poor handling during installation.
Operators must benchmark these losses against industry standards. Standard degradation benchmarks expect approximately 2-3% loss in year one. Afterward, panels typically degrade at about 0.5% annually. Losses exceeding these baselines signal premature hardware failure.
Table 1: Key Differences Between Soiling and Degradation
Characteristic
Soiling
Degradation
Nature of Loss
Temporary and reversible
Permanent and irreversible
Primary Causes
Dust, pollen, snow, bird droppings
LID, PID, UV exposure, micro-cracks
Recovery Method
Manual cleaning or natural rainfall
None (Requires hardware replacement)
Data Signature
Sawtooth pattern, seasonal variations
Steady, smooth downward trajectory
Diagnostic Framework: How to Isolate Soiling from Degradation in PR Data
Raw energy output data provides an incomplete picture. Daily sunlight and temperature fluctuate wildly. To find the true cause of a performance drop, operators must normalize the data and strip away environmental noise.
Establishing an Accurate Baseline
You must use weather-corrected PR data. This mathematical normalization removes varying irradiance and temperature fluctuations from your evaluation. A solar panel naturally produces less power on a cloudy, hot day. Normalizing the data ensures you evaluate the system's underlying health, rather than just the day's weather.
However, baseline distortion poses a major risk. For assets utilizing modern architectures, complex variables easily skew expected targets. Failing to correctly model the expected bifacial module power gain (albedo contributions) creates massive blind spots. Ground reflection changes seasonally. Snow reflects highly, while dry dirt absorbs light. If your baseline assumes a static ground reflection, seasonal albedo drops will artificially inflate expected targets. This leads operators to misdiagnose normal seasonal shifts as permanent hardware degradation.
Analyzing Trend Signatures
Once you normalize the data, specific visual patterns emerge. We call these trend signatures.
The Soiling Signature: Look for pronounced sawtooth patterns in the data. System output drops gradually during extended dry periods. It then sharply recovers immediately following significant rainfall or manual cleaning interventions. This creates a jagged graph over time.
The Degradation Signature: Look for a smooth, downward trajectory. This decline persists year-over-year. It ignores precipitation. Manual cleaning interventions do not alter this downward slope. It is a slow, relentless erosion of expected yield.
Isolating Localized vs. Systemic Issues
You must determine the physical scope of the problem. Is the entire plant underperforming, or just one section? String-level monitoring helps identify localized severe soiling. For example, a specific array near an unpaved dirt road will show a massive PR drop compared to arrays further away. In contrast, site-wide systemic degradation typically presents as a uniform performance drop across all inverters and strings simultaneously.
Common Diagnostic Mistakes to Avoid
Many operators rely entirely on inverter-level data. This masks string-level faults. A heavily soiled string blends in with clean strings, hiding the problem. You should always drill down to the most granular data available before ordering an inspection.
Measurement and Evaluation Tools for Accurate Triage
Software algorithms sometimes need physical validation. Deploying specialized measurement tools helps confirm whether your normalized data models align with reality.
On-Site Soiling Sensors
Direct measurement removes guesswork. We advise evaluating the use of optical soiling sensors or reference cell pairs. A reference cell pair uses two small solar panels. You clean one daily. You allow the other to soil naturally. By comparing their outputs, you generate a precise, localized Soiling Ratio (SR). Implementation reality dictates strategy here. These sensors carry a high upfront cost. However, they remain crucial for utility-scale sites in arid environments where dust storms frequently skew data.
Advanced PR Analytics and Software
Modern asset management relies on artificial intelligence. Digital twin models create a virtual replica of your solar plant. The software calculates exactly how much power the plant should produce at any given second. AI-driven performance analytics automatically decouple degradation curves from temporary environmental losses. They filter out complex variables and flag issues long before humans spot them in a spreadsheet.
Physical Hardware Testing (IV Curve Tracing)
When software suggests permanent damage, physical testing proves it. Position IV curve tracing as your definitive diagnostic tool when permanent degradation is suspected. An IV curve tracer connects directly to the solar strings. It sweeps the electrical load and plots the relationship between current (I) and voltage (V).
Shifts in the IV curve confirm internal cellular degradation rather than surface obstruction. If you see a severe drop in short-circuit current (Isc) alongside a significant drop in open-circuit voltage (Voc), you likely face internal material breakdown. Soiling generally impacts current, but voltage remains largely stable. Identifying these specific curve shapes validates hardware failure definitively.
ROI-Driven Next Steps: Cleaning Protocols vs. Warranty Claims
Once you separate temporary dirt from permanent damage, you must act. Your next steps must focus purely on financial recovery and asset protection.
Evaluating Cleaning Interventions
You should introduce a strict cost-benefit framework for recoverable loss. The rule is simple. Do not clean unless the projected revenue loss from the current Soiling Ratio exceeds the mobilization and execution cost of the cleaning crew. If cleaning costs $5,000 but the dust only causes a $3,000 revenue loss, washing the panels destroys value.
Furthermore, operators must highlight the implementation risks of over-cleaning. Constant washing causes abrasive damage to the anti-reflective coatings on the glass. Harsh brushes or dirty water create micro-scratches. These scratches permanently reduce light transmission, transforming a recoverable soiling issue into permanent degradation.
Executing a Warranty Strategy for a Degraded PV Module
If testing confirms permanent hardware failure, you must hold the manufacturer accountable. Executing a warranty strategy for a degraded PV module requires meticulous preparation. Manufacturers fiercely defend against warranty payouts. You must present undeniable evidence.
Outline your evidentiary requirements early. Approaching an OEM requires:
Normalized PR data spanning multiple years to show the historical trend.
Independent IV curve test results proving abnormal electrical behavior.
Flash test comparisons conducted in a certified third-party laboratory.
Use clear shortlisting logic. If the diagnosed degradation strictly exceeds the performance warranty threshold (e.g., greater than 10% loss in year 10), initiate standard operating procedures immediately. Push for module replacement or direct financial compensation to cover the lost energy revenue.
Conclusion
Distinguishing between recoverable soiling and permanent degradation is fundamentally an exercise in data hygiene and threshold management. Without clean data, operators guess blindly, wasting capital on unnecessary maintenance while ignoring terminal hardware failures. Accurate diagnostics protect your project returns.
Investing in granular monitoring transitions an O&M strategy from reactive troubleshooting to proactive asset management. Deploying string-level data, physical soiling sensors, and precise modeling of complex variables like bifacial gains ensures you catch problems early. It provides the visibility required to make strictly ROI-positive decisions.
Take action today. We urge you to audit your current diagnostic workflows. Review your data normalization protocols and physical testing standards before finalizing your next quarter's O&M budgets. Early detection guarantees higher lifetime yields.
FAQ
Q: How much performance loss is normal for a new PV module?
A: First-year Light-Induced Degradation (LID) typically causes a 2-3% performance drop. This occurs as oxygen and boron react within the silicon upon initial sun exposure. Following the first year, long-term annual degradation normally averages around 0.5%. These are permanent but entirely expected losses accounted for in baseline models.
Q: Can heavy soiling cause permanent damage?
A: Yes. Localized, severe soiling creates dangerous thermal dynamics. Concentrated blockages, like large bird droppings or thick sap, cause the shaded cell to consume power rather than generate it. This creates severe hot spots. If left untreated, these hot spots eventually lead to permanent cell damage, micro-cracking, or backsheet failure.
Q: How does rain affect the soiling vs. degradation diagnosis?
A: Significant rainfall acts as a natural control mechanism for diagnostics. After a heavy rain event, analyze the normalized PR data. If the performance ratio immediately returns to the expected baseline, the previous loss was merely soiling. If the PR remains suppressed, degradation or electrical faults require immediate investigation.
Q: Why is bifacial module power gain difficult to factor into performance metrics?
A: Seasonal changes in ground albedo cause heavily fluctuating rear-side yield. Ground reflectivity varies drastically between winter snow cover and summer dry dirt. This inconsistency complicates the establishment of a static performance baseline. Without dynamic albedo modeling, operators often misinterpret rear-side yield drops as front-side panel degradation.