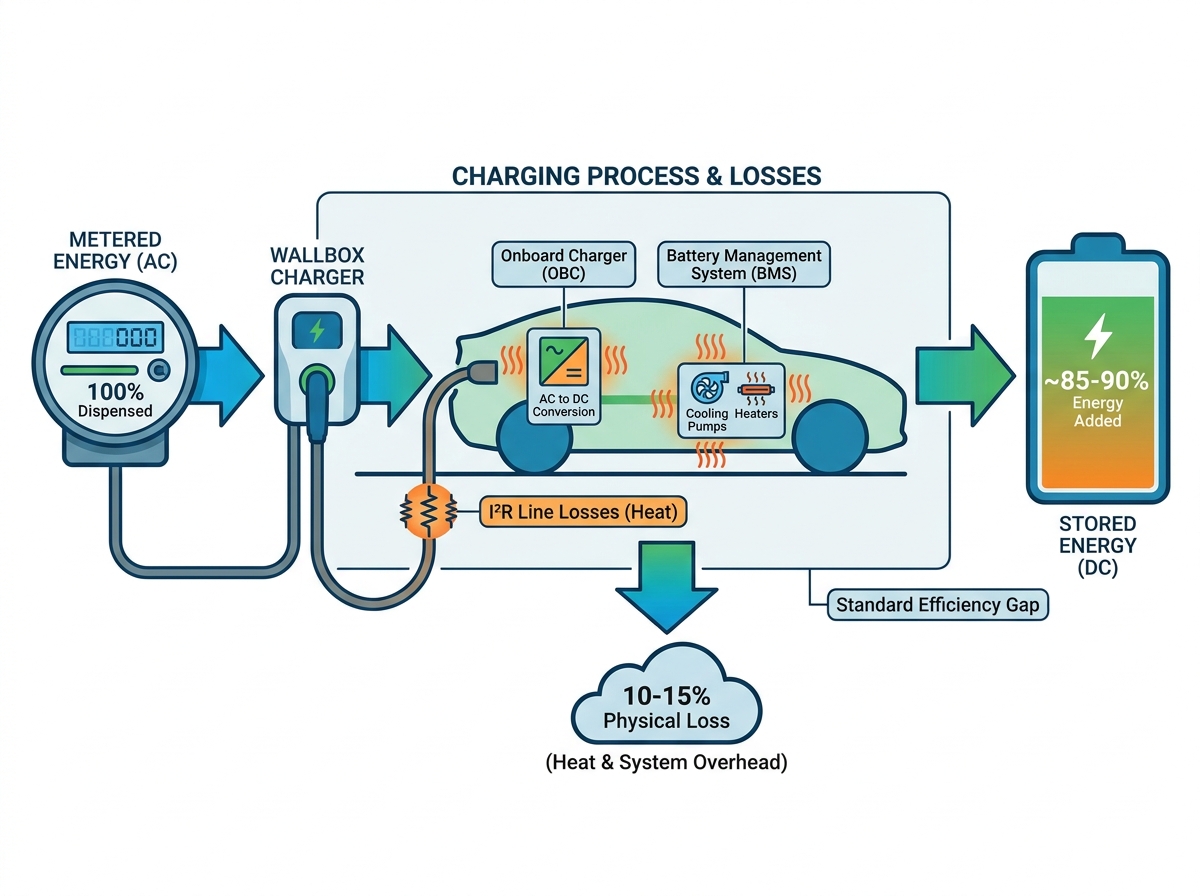
You plug in your electric vehicle. You expect a straightforward transaction. The utility bill arrives a few weeks later. You check the numbers, and they simply do not match your dashboard data. You pay for 60 kWh, yet your battery only gained 52 kWh. This discrepancy causes significant friction for EV owners.
Many drivers immediately suspect a hardware malfunction. Others worry about billing errors at public stations. In reality, a 10% to 20% energy loss represents a standard physical reality in EV charging. It is an inherent part of the electrical process, not a scam. Understanding this gap is crucial for anyone managing daily energy consumption.
This guide helps you navigate baseline physical losses. We will help you identify preventable infrastructure waste in your garage or parking facility. You will learn how to evaluate hardware upgrades. These improvements minimize your everyday energy expenses. Let us explore where your electricity actually goes when you plug in.
Key Takeaways
Energy discrepancy is primarily driven by the vehicle’s onboard inverter converting AC to DC power, alongside thermal management systems (BMS).
Standard energy losses range from 10% to 20%; losses exceeding this threshold indicate potential infrastructure inefficiencies (e.g., undersized cabling).
Upgrading to a premium AC EV charger with high-efficiency components and proper cable sizing significantly reduces preventable line losses.
Optimizing EV charging time and integrating a home energy storage system can offset the financial impact of inevitable physical charging losses.
The Physics of Charging Losses: Where Does the Energy Actually Go?
Electricity does not travel from the grid to your car battery in a perfect, lossless vacuum. The journey involves several physical transformations. Each step demands a small operational tax. We can categorize these mandatory energy expenditures into three main areas.
The AC-to-DC Conversion Tax
The grid supplies alternating current (AC) to your property. However, a lithium-ion battery can only store direct current (DC). Every time you use an AC EV charger, you deliver alternating current to the vehicle. The car relies on its Onboard Charger (OBC) to bridge this gap. The OBC functions as a heavy-duty inverter. It actively converts the incoming AC wave into a flat DC line. This intense conversion process generates substantial heat. Shedding this heat accounts for the largest single percentage of your overall energy loss.
Battery Management System (BMS) Overhead
Your vehicle features a sophisticated computer called the Battery Management System. This system stays completely awake during the entire session. It performs constant diagnostic checks. The BMS balances individual cell voltages. It also regulates battery pack temperatures. If the cells get too warm, the BMS activates liquid cooling pumps. If the cells drop below freezing, it turns on resistive heaters. These mechanical components draw electricity directly from the grid while charging. We consider this active power consumption a necessary overhead.
I²R Line Losses (Joule Heating)
Electrical physics dictate a strict rule about resistance. Copper wires are excellent conductors, but they are not perfect. When electrons flow through building wiring and charging cables, they encounter microscopic friction. This friction creates electrical resistance. The scientific term for this phenomenon is Joule heating, often represented by the formula I²R. Energy dissipates as ambient heat before it even reaches the vehicle port. Longer cable runs naturally create higher resistance and larger energy losses.
Quantifying the Gap: What is an Acceptable Loss Margin?
Now we understand the physics behind the discrepancy. The next step involves defining a normal baseline. Not all charging configurations perform at the exact same efficiency. You must know your expected baseline to identify abnormal hardware behavior.
Industry Benchmarks
Electrical engineers and automotive manufacturers rely on established efficiency benchmarks. Level 2 setups generally operate at 85% to 90% efficiency. This means you should expect a standard 10% to 15% energy loss. Level 1 setups plugging into standard 120V outlets perform noticeably worse. They often suffer from 15% to 25% energy loss. This happens because the BMS runs longer at slower speeds. We will outline these differences below.
Expected Efficiency Baselines by Charging Tier
Hardware Type
Voltage Input
Acceptable Loss Range
Primary Inefficiency Driver
Level 1 Portable
120V
15% - 25%
Extended BMS active time due to slow speeds.
Level 2 Station
240V
10% - 15%
Standard AC-to-DC conversion heat.
DC Fast Charging
400V - 800V
5% - 10%
Cable resistance and station cooling systems.
Vehicle vs. Station Telemetry
Different software platforms measure different points of the energy transfer. Utility meters and charging station apps measure gross energy output. They record every electron pushed into the cable. This number dictates your financial billing. Conversely, the vehicle API measures net energy stored. It only records electricity successfully locked into the chemical cells. You are comparing dispensed energy against stored energy. A gap will always exist between these two datasets.
Red Flags for Hardware Evaluation
While a 15% loss is perfectly normal, excessive waste requires immediate attention. If your telemetry consistently shows losses exceeding 20% under mild weather conditions, you have a problem. This threshold signals severe infrastructure inefficiencies. You might have corroded internal relays. You might be using dangerously undersized cables. When numbers cross the 20% mark, you should audit your electrical panel and replace degraded equipment.
How Environmental Factors and EV Charging Time Impact Efficiency
Physics provide the baseline, but the environment dictates daily performance variations. External temperatures and session durations heavily manipulate your final efficiency numbers. You must account for these moving targets when evaluating your data.
Thermal Extremes
Weather plays a massive role in electrical consumption. Lithium-ion batteries refuse to accept energy efficiently when frozen. During sub-freezing temperatures, the vehicle forces a warm-up sequence. It uses metered wall energy to heat the battery block before accepting a heavy charge. This temporarily spikes the loss ratio. You might see a 30% discrepancy on a freezing January night. The car spends the first portion of the session purely acting as a space heater.
The Impact of Charging Speed
Your overall EV charging time directly correlates with overhead waste. Slow charging damages your efficiency curve. If you use a 120V outlet, the session might take 30 hours. Your vehicle computers and cooling pumps stay awake for those entire 30 hours. They draw constant background power. Upgrading to an optimal 240V/48A setup shrinks the session to just six hours. This puts the computers to sleep faster. You consume a much lower percentage of total energy draw on baseline overhead.
Charge Curve Tapering
Batteries do not fill at a linear pace. Pushing energy into an empty pack is highly efficient. As the pack reaches 80% capacity, internal resistance increases dramatically. The battery chemistry pushes back against incoming electrons. The vehicle must slow down the input to prevent cell damage. Charging from 80% to 100% requires more time and generates more heat waste compared to charging from 20% to 40%.
Infrastructure Evaluation: Mitigating Preventable System Losses
You cannot change the laws of physics. However, you can eliminate preventable friction from your property. Subpar installations generate excessive resistance. Evaluating your current setup reveals clear opportunities for hardware optimization.
Cable Sizing and Distance
Electrical wire gauge dictates flow capacity. Thinner wires create tighter bottlenecks. Pushing heavy continuous loads through a 6 AWG wire generates noticeable warmth. That warmth represents wasted electricity leaking out of the jacket. We strongly emphasize the ROI of up-sizing your wire gauge. Installing thicker 4 AWG wire reduces this friction substantially. It prevents resistance heat over long distance runs from your main breaker to the garage.
Hardware Component Quality
Not all wall units deliver power equally. Cheaply manufactured stations use poor internal conductors. You must prioritize component quality when shortlisting hardware. Look for these specific traits:
Pure Copper Internals: Avoid units relying on cheap alloy contacts. Copper minimizes internal resistance and prevents plug overheating.
Thermal Throttling Firmware: Premium units monitor plug temperatures continuously. They modulate current output safely to prevent melting or energy waste.
UL/CE Compliance: Regulatory certifications ensure the product meets strict efficiency and safety standards under continuous loads.
Smart Diagnostics
Modern problems require modern monitoring. We recommend selecting hardware equipped with granular data logging capabilities. Smart software allows you to monitor voltage drops in real-time. You can track efficiency degradation over a span of several years. If internal contacts begin to corrode, the app will show a gradual increase in energy waste. You catch the problem before it becomes a safety hazard.
Strategic Energy Management for Cost Efficiency
Since we cannot eliminate the 10% to 15% conversion tax, we must offset its financial impact. Strategic energy management turns an unavoidable physical loss into a negligible expense. Smart ecosystems provide a comprehensive solution.
Cost Offsetting Strategies
Advanced infrastructure serves as a powerful financial shield. You might lose 15% of your energy to heat, but you can control what you pay for that energy. Implementing intelligent scheduling protocols neutralizes the sting of baseline losses. The goal is paying the absolute minimum per unit of electricity dispensed.
Time-of-Use (TOU) Optimization
Utility companies often implement Time-of-Use rates. They charge premium prices during late afternoon peaks. They offer massive discounts during overnight hours. Smart scheduling ensures your inherent physical losses occur during the cheapest possible rate windows. If you must lose 15% of your energy to heat, ensure you lose it when electricity costs five cents per kilowatt-hour, rather than twenty-five cents.
Ecosystem Integration
True cost efficiency requires a holistic approach. We highly recommend pairing your vehicle setup with a home energy storage system. This ecosystem allows users to capture excess solar generation during peak sunlight hours. You store this free solar power locally. Later, you discharge it into your vehicle. This integration ensures the energy "lost" during conversion is generated for free on your roof, rather than purchased retail from the grid.
Conclusion
Zero-loss charging remains physically impossible. The conversion from AC to DC power inherently demands an energy tax. However, informed hardware decisions keep these mandatory losses at an absolute minimum. Understanding where your electricity goes empowers you to stop wasting money on poor infrastructure.
Take actionable steps to optimize your daily usage. We suggest implementing these immediate improvements:
Audit your current cabling setup to verify wire gauge thickness handles continuous loads efficiently.
Calculate your vehicle's typical loss baseline using your utility app and dashboard API data.
Upgrade to high-efficiency charging hardware featuring pure copper internals and strict UL/CE compliance.
Integrate smart scheduling routines to shift unavoidable baseline waste into low-cost utility windows.
By controlling your infrastructure quality, you maintain complete authority over your operational expenses.
FAQ
Q: Why am I billed for 60 kWh when my battery only increased by 52 kWh?
A: The utility meter records gross dispensed energy at the wall. This number includes the electricity your vehicle uses to convert alternating current to direct current. It also includes the energy used by cooling pumps and computers during the session. Your battery API only records the net stored energy. This gap is a normal physical conversion loss.
Q: Does lowering the charging amperage improve efficiency?
A: Lowering amperage reduces heat generated by line resistance. However, it significantly extends the total duration of the session. A longer session means your vehicle's onboard computers and cooling systems stay awake drawing background power for many hours. Optimal efficiency usually occurs at the highest amperage the onboard converter handles without triggering aggressive thermal throttling.
Q: Is DC Fast Charging more efficient than AC charging?
A: DC chargers completely bypass the car's onboard converter. This shifts the heavy AC-to-DC conversion heat from your garage to the external commercial station. The vehicle accepts DC power directly. However, high-power DC charging generates immense external heat. It requires massive active cooling systems at the station level. System-wide losses are still present, just relocated.
Q: Can a faulty EV charger cause higher energy losses?
A: Yes. Degraded internal contacts, cheap aluminum wiring, or failing internal relays create excessive electrical resistance. This forces the hardware to generate abnormal amounts of heat instead of delivering power to the vehicle. This unnecessary resistance translates directly into higher metered usage and larger utility bills.